what is stress-strain curve ?
A stress-strain curve is a graphical representation that illustrates the relationship between the applied stress and the resulting strain in a material subjected to mechanical loading. This curve provides valuable insights into how a material responds to external forces and how it deforms under different levels of stress. The stress-strain curve is a fundamental tool used in materials science and engineering to understand the mechanical properties of materials and predict their behaviour under various conditions.
Must Read : Mechanical Properties of Materials
Explaining Stress-Strain Graph
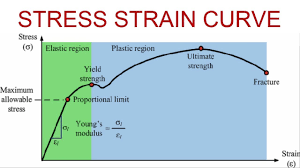
Breaking down the components embedded within the stress-strain curve:
- Stress (σ): Stress embodies the quantification of the internal force, diligently exerted by a material per unit area, which manifests due to the imposition of external forces. This paramount parameter is calculated through the meticulous division of the applied force by the original cross-sectional area of the material. Evidently portrayed along the vertical axis of the stress-strain curve, stress assumes a central role in characterizing material behavior.
- Strain (ε): Strain, a pivotal counterpart to stress, meticulously gauges the extent of deformation experienced by a material in direct response to the applied stress. This imperative metric stands as the ratio of the observable alteration in length (referred to as deformation) in relation to the initial length of the material. Exemplifying its presence along the horizontal axis of the stress-strain curve, strain is an indispensable parameter essential for decoding material response.
- Elastic Region: At the embryonic stage of the curve, encompassing the onset of stress application, materials predominantly engage with an elastic response. Within this phase, deformation bears a proportional correlation to the applied stress, and upon the removal of stress, the material promptly regains its original configuration. The gradient characterizing this phase carries paramount significance, embodying the elastic modulus, a quantitative measure of the material’s inherent stiffness.
- Yield Point: As the material experiences escalating stress, it ultimately encounters the yield point, a juncture demarcating the transition to permanent deformation, known as plastic deformation. This transition often materializes as a discernible drop in stress without a concurrent substantial escalation in strain, signifying the inception of the material’s plastic behavior.
- Plastic Region: Evolving beyond the yield point, the material advances through the plastic region, wherein deformation continues unabatedly, albeit bereft of any proportional stress augmentation. Accompanying this phase, the material’s structural constituents engage in dynamic reconfiguration, typified by dislocation movement, facilitating plastic deformation. The stress-strain curve in this span delineates a gradual rise in strain bereft of a corresponding surge in stress.
- Ultimate Tensile Strength: The zenith of this intricate curve is embodied by the ultimate tensile strength, a paramount threshold representing the utmost stress a material can endure before succumbing to fracture. This pinnacle point holds a mirror to the material’s tensile strength, encapsulating its resolute capacity to withstand stress-induced tension.
- Fracture Point: Beyond the acme of the ultimate tensile strength, the material embarks upon an expedition of rapid deformation, culminating inevitably in fracture. This denouement, marking the terminal juncture of the stress-strain curve, witnesses the material’s structural integrity yielding to the forceful effects of stress, ultimately leading to its rupture.
- Ductility: The concept of ductility, integral within this contextual narrative, elucidates the degree to which a material is capable of undergoing plastic deformation prior to reaching the point of fracture. This pivotal trait is often gauged through the quantification of strain at the juncture of fracture. Materials that exhibit an inherent ability to stretch substantially before yielding to fracturing are designated as ductile, in stark contrast to their brittle counterparts that evince minimal plastic deformation prior to fracture.
- Stress-Strain Behavior: The geometric contours of the stress-strain curve, elucidating the nuanced interplay between stress and strain, imbue this graphical representation with profound insights into the behavioral tendencies of a diverse array of materials. The distinctive and discernible curve shapes encapsulated within this graphical representation are emblematic of the material’s unique composition, microstructural attributes, and the methodologies employed during its processing.
In summation, the stress-strain curve emerges as an indomitable and indispensable instrument, succinctly encapsulating the dynamic interrelationship between applied stress and ensuing strain. As an invaluable aid, it facilitates the meticulous assessment of material properties, orchestrates the blueprint for structuring endeavours, and envisages the course of material behaviour across multifarious engineering applications and contexts.
How is the Stress vs Strain Curve Measured?
The process of measuring a stress-strain curve involves systematic experimental procedures in which the material’s response to applied stress and subsequent strain is meticulously recorded. This process typically unfolds as follows:
- Specimen Preparation: A representative sample of the material, known as a test specimen, is carefully prepared according to standardized dimensions and specifications. The specimen’s geometry, including length, cross-sectional area, and shape, is critical for obtaining accurate and comparable results.
- Mounting the Specimen: The prepared specimen is securely mounted within a testing machine, often referred to as a universal testing machine or a materials testing apparatus. The machine is equipped with fixtures that hold the specimen in place to ensure proper loading during the test.
- Zeroing and Calibration: Before initiating the test, the testing machine is calibrated to ensure accurate measurements. This involves zeroing out any initial load or displacement readings to establish a reference point.
- Applying Load: The test begins by gradually applying an axial load to the specimen using the testing machine. The load can be applied in tension (stretching the specimen) or compression (compressing the specimen), depending on the desired test.
- Recording Load and Displacement: As the load is applied, the testing machine records both the applied load and the corresponding displacement or elongation of the specimen. These measurements are crucial for calculating stress and strain.
- Calculating Stress and Strain: Stress is calculated by dividing the applied load by the original cross-sectional area of the specimen. Strain is calculated by dividing the change in length (elongation or compression) by the original length of the specimen. These calculations yield stress and strain values for each load increment.
- Plotting the Curve: The calculated stress and strain values are then plotted on a graph, with stress typically on the vertical axis and strain on the horizontal axis. This plotting process gradually forms the stress-strain curve.
- Elastic Behavior: Initially, the stress-strain curve depicts a linear region, representing the elastic behavior of the material. The slope of this region corresponds to the material’s elastic modulus.
- Yield and Plastic Deformation: As the applied stress increases, the curve deviates from linearity, indicating the onset of plastic deformation. The point at which this deviation occurs is known as the yield point, marking the transition to permanent deformation.
- Plastic Region: Beyond the yield point, the stress-strain curve exhibits plastic deformation without a corresponding increase in stress. This region provides insights into the material’s plastic behavior and its ability to sustain deformation.
- Ultimate Tensile Strength and Fracture: The curve reaches its peak at the ultimate tensile strength, where the material can withstand the highest stress before fracturing. Beyond this point, the curve typically drops as the material undergoes rapid deformation leading to fracture.
- Analysis and Interpretation: Engineers and researchers analyze the stress-strain curve to glean valuable information about the material’s mechanical properties, including stiffness, yield strength, ultimate strength, ductility, and fracture behavior.
In summary, the process of measuring a stress-strain curve involves subjecting a prepared test specimen to controlled loading while simultaneously measuring the applied load and specimen deformation. This data is then used to calculate stress and strain values, which are plotted to form the stress-strain curve. The resulting curve provides critical insights into the material’s mechanical behavior and properties.
Stress-Strain Curve for Various Materials
The stress-strain curves for various materials exhibit distinctive behaviors due to their unique compositions, structures, and properties. Here’s an overview of how stress-strain curves can differ for different classes of materials:
- Ductile Materials (e.g., Mild Steel, Aluminum): Ductile materials are characterized by their ability to undergo significant plastic deformation before fracturing. Their stress-strain curves typically display a gradual yielding phase followed by a substantial plastic region. The curve gradually rises until reaching the ultimate tensile strength, and then drops as the material elongates further before eventual fracture. These materials exhibit a substantial area under the stress-strain curve, indicating high energy absorption capacity.
- Brittle Materials (e.g., Ceramics, Some Polymers): Brittle materials, in contrast, have limited plastic deformation capabilities and tend to fracture with minimal warning once the yield point is surpassed. Their stress-strain curves often exhibit a steep rise in stress until they reach the ultimate tensile strength, followed by a sudden drop as the material fractures. The lack of significant plastic deformation is reflected in the minimal area under the curve.
- Elastomers (e.g., Rubber): Elastomers are highly elastic materials that can undergo substantial deformation under low stress levels. Their stress-strain curves exhibit a nearly linear relationship in the elastic region, followed by a more gradual increase in stress as they enter the yield and plastic deformation phase. Elastomers often have a low ultimate tensile strength compared to other materials.
- Composites (e.g., Fiber-Reinforced Composites): Composite materials, which consist of multiple phases with varying properties, can exhibit stress-strain curves that vary depending on the matrix material and reinforcing fibers. In fiber-reinforced composites, the curve might show an initial linear elastic region, followed by a nonlinear behavior as the matrix and fibers interact differently under stress.
- Superalloys (e.g., Nickel-Based Superalloys): Superalloys are known for their exceptional strength and resistance to high temperatures. Their stress-strain curves often exhibit gradual yielding, followed by a relatively flat plastic region, and finally a distinct drop in stress as they approach fracture. The ability to maintain strength at elevated temperatures is a crucial feature of superalloys.
- Polymers (e.g., Thermoplastics, Thermosets): Polymers can vary widely in their mechanical behavior. Thermoplastics tend to exhibit ductile behavior with a gradual yielding and plastic region, while thermosetting polymers might show a more brittle response with limited plastic deformation.
- Metals (e.g., Copper, Titanium, Brass): The stress-strain curves for metals can vary based on their crystalline structure, alloy composition, and heat treatment. Some metals show pronounced yielding followed by plastic deformation, while others might have a more gradual transition to plastic behavior.
- Natural Materials (e.g., Wood, Bone): Natural materials like wood and bone can display complex stress-strain behavior due to their hierarchical structure. They might exhibit an initial elastic region, followed by plastic deformation and even some recovery due to microstructural rearrangements.
In essence, the stress-strain curve for each material type is a manifestation of its intrinsic properties and response to mechanical loading. Analyzing these curves helps engineers and researchers understand how materials behave under stress, aiding in materials selection, design, and applications across various industries.
Classification of Stress–strain curve
Stress-strain curves can be classified into several categories based on the behavior they exhibit during mechanical testing. Here are some common classifications:
- Ductile Material Curve: Ductile materials, such as mild steel and aluminum, display stress-strain curves characterized by significant plastic deformation before fracturing. These curves show a well-defined yield point, followed by a plastic region where the material undergoes deformation without an immediate increase in stress. Ductile materials often have elongated curves with a gradual drop in stress after reaching the ultimate tensile strength.
- Brittle Material Curve: Brittle materials, like ceramics and some polymers, exhibit stress-strain curves with limited plastic deformation capacity. These curves lack a distinct yield point and show a steep rise in stress until reaching the ultimate tensile strength, followed by a sudden drop as the material fractures. The area under the curve for brittle materials is relatively small compared to ductile materials.
- Elastic Material Curve: Elastic materials, such as rubber and elastomers, showcase stress-strain curves characterized by high elasticity and minimal plastic deformation. These curves have a linear elastic region with a proportional relationship between stress and strain. The material returns to its original shape once the stress is removed.
- Composite Material Curve: Composite materials, comprising different phases like fibers and matrices, can exhibit a wide range of stress-strain behaviors. Fiber-reinforced composites often show a linear elastic region followed by a nonlinear response due to interactions between the matrix and fibers.
- Work Hardening Material Curve: Some materials, like certain metals and alloys, exhibit work hardening behavior. Their stress-strain curves display a gradual increase in stress after the yield point due to the creation and accumulation of dislocations, resulting in increased material strength.
- Superelastic Material Curve: Shape memory alloys and certain polymers exhibit superelastic behavior, where they can undergo large deformations and recover their original shape upon unloading. Their stress-strain curves often exhibit distinct plateaus during loading and unloading cycles.
- Anisotropic Material Curve: Anisotropic materials, having different properties in different directions, can exhibit stress-strain curves with varying behavior depending on the loading direction. The curves might differ significantly along different axes.
- Temperature-Dependent Curve: The behavior of materials can change with temperature. Some materials, like polymers, might display different stress-strain behaviors at elevated temperatures compared to room temperature.
- Rate-Dependent Curve: Certain materials exhibit rate-dependent behavior, where their stress-strain curves vary depending on the loading rate. Metals and polymers, for example, might behave differently under quasi-static and dynamic loading conditions.
- Nonlinear Elastic Material Curve: Some materials exhibit nonlinear elastic behavior, where the stress-strain curve deviates from linearity even in the elastic region. This behavior is often observed in rubber-like materials and elastomers.
These classifications highlight the diversity of stress-strain curves and the variety of material responses under different loading conditions. Understanding these classifications helps engineers and researchers predict material behaviour and make informed decisions in various applications.
application of stress-strain curve
The stress-strain curve is a graphical representation of the relationship between the stress applied to a material and the resulting strain it experiences. This curve is a fundamental tool used in materials science and engineering to understand and predict the behavior of materials under different loading conditions. Here are some key applications of the stress-strain curve:
- Material Characterization: The stress-strain curve provides valuable information about the mechanical properties of a material, such as its stiffness (modulus of elasticity), strength (yield, ultimate, and fracture), and ductility. These properties are crucial for selecting materials for specific applications and ensuring their performance under various conditions.
- Design and Engineering: Engineers use stress-strain curves to design structures and components that can withstand the expected mechanical loads. By analyzing the curve, they can determine if a material will behave elastically or plastically, and whether it will experience permanent deformation or failure under specific stress levels.
- Quality Control: Manufacturers use stress-strain curves to ensure the consistency and quality of materials produced. By comparing the curves of different batches or lots, they can identify any variations in material properties that might affect the performance of the final products.
- Failure Analysis: When a material or structure fails, analyzing its stress-strain curve can help investigators understand the cause of failure. Sudden drops in stress may indicate yield points, while changes in slope could indicate transitions from elastic to plastic deformation or the onset of fracture.
- Material Selection: Different applications require materials with specific mechanical properties. For example, a bridge might need a material with high strength and stiffness, while a forming process might require a material with good ductility. Stress-strain curves help in selecting the right material for each application.
- Research and Development: Scientists and researchers use stress-strain curves to study the behavior of new materials or materials subjected to extreme conditions, such as high temperatures or pressures. This information contributes to the development of innovative materials for various industries.
- Safety Assessment: Industries like aerospace, automotive, and construction use stress-strain curves to assess the safety and reliability of their products. This is particularly important in situations where components may experience unpredictable or extreme loads.
- Predicting Deformation: By analyzing the curve’s post-yield behavior, engineers can predict how a material will deform under certain loads. This is crucial for designing products that can absorb energy or undergo controlled deformation, such as impact-absorbing materials in helmets or car bumpers.
- Process Optimization: Manufacturers can use stress-strain data to optimize manufacturing processes, such as heat treatment or forming, to achieve desired mechanical properties in the final product.
In essence, the stress-strain curve serves as a fundamental tool for understanding how materials respond to mechanical loads, enabling informed decisions in materials selection, design, production, and failure analysis across various industries.
advantage of Stress–Strain curve
The stress-strain curve offers several advantages in various fields of engineering and materials science due to its ability to convey valuable information about material behavior under mechanical loads. Some of the key advantages of the stress-strain curve include:
- Comprehensive Material Insight: The stress-strain curve provides a comprehensive overview of a material’s mechanical properties, including its elastic modulus, yield strength, ultimate strength, and ductility. This information is essential for selecting appropriate materials for specific applications.
- Predicting Material Behavior: Engineers can predict how a material will respond to different levels of stress and strain based on its stress-strain curve. This predictive capability is crucial for designing structures, components, and products that can withstand expected loads without failure.
- Comparative Analysis: The stress-strain curve allows for easy comparison between different materials or material batches. This is particularly useful for quality control and ensuring consistent material performance in various manufacturing processes.
- Design Optimization: Engineers can use the stress-strain curve to optimize designs by selecting materials that offer the best balance of stiffness, strength, and ductility for a given application. This leads to more efficient and effective designs.
- Safety Assessment: Industries that prioritize safety, such as aerospace and automotive, use stress-strain curves to assess whether materials can withstand extreme conditions and unexpected loads without catastrophic failure.
- Failure Analysis: When materials or structures fail, analyzing the stress-strain curve can provide insights into the failure mechanism. This aids in understanding why and how a material failed, leading to improvements in design and materials selection.
- Process Improvement: Manufacturers can fine-tune their manufacturing processes by studying stress-strain curves. This helps in achieving desired material properties and improving product consistency.
- Innovation and Research: Researchers can use stress-strain curves to explore the behavior of new materials, test novel manufacturing techniques, and develop advanced materials with tailored mechanical properties.
- Economic Benefits: By accurately predicting material behavior, the stress-strain curve helps avoid overengineering, ensuring that materials are used efficiently without unnecessary excess or waste.
- Education and Communication: The stress-strain curve is a powerful educational tool that aids in conveying complex material concepts to students, engineers, and researchers. It provides a visual representation of how materials respond to stress and strain, making it easier to grasp key concepts.
- Standardization: Stress-strain testing and curve analysis are standardized methods in materials testing. This standardization ensures consistent and comparable results across different laboratories and industries.
- Environmental Impact: Understanding a material’s stress-strain behavior can contribute to sustainable design by helping engineers create longer-lasting products with reduced need for replacements, thus minimizing waste.
In summary, the stress-strain curve’s advantages lie in its ability to provide critical insights into material behavior, guide design decisions, enhance safety, facilitate research and innovation, and contribute to efficient manufacturing processes. Its widespread use across various industries underscores its importance as a fundamental tool in materials science and engineering.
disadvantage of Stress–Strain curve
While the stress-strain curve is a valuable tool in materials science and engineering, it also has some limitations and disadvantages that should be considered:
- Simplified Representation: The stress-strain curve provides a simplified representation of material behavior under load. It assumes uniform stress and strain distribution, which might not accurately reflect real-world conditions where stress concentrations, gradients, and non-uniform deformation occur.
- Static Behavior: The stress-strain curve is based on static loading conditions. It doesn’t capture dynamic or time-dependent effects that might be crucial in situations involving rapid loading, impact, or cyclic loading.
- Single-Axial Loading: The stress-strain curve typically represents uniaxial loading, where stress is applied in one direction. However, many real-world structures and components experience multi-axial loading, which can lead to complex stress states not fully captured by a single curve.
- Temperature and Environment: The stress-strain curve is often obtained under specific temperature and environmental conditions. Material behavior can change significantly under different temperatures, humidity levels, and corrosive environments, which might not be accounted for in a single curve.
- Sample Size and Shape: The stress-strain curve is influenced by the size and shape of the test specimen. Small-scale testing might not accurately represent the behavior of larger structures, and irregularly shaped samples might not yield representative results.
- Anisotropic Materials: For anisotropic materials (materials with different properties in different directions), a single stress-strain curve might not capture their complex behavior accurately.
- Brittle Materials: The stress-strain curve might not effectively represent the behavior of brittle materials like ceramics or some polymers. These materials often exhibit sudden failure without well-defined plastic deformation stages.
- Rate-Dependent Behavior: Some materials exhibit rate-dependent behavior, meaning their response to stress and strain changes with loading rate. The stress-strain curve might not fully capture this behavior.
- Complex Loading Scenarios: Real-world structures can experience complex loading scenarios that involve combinations of tension, compression, torsion, and shear. The stress-strain curve might not provide a complete picture in such cases.
- Microstructural Effects: The stress-strain curve doesn’t capture microstructural changes that can occur in materials under load, such as phase transformations, grain growth, and dislocation movement.
- Environmental Degradation: The stress-strain curve might not account for long-term effects of environmental factors like fatigue, creep, and stress corrosion cracking, which can lead to material degradation over time.
- Variability: Material properties can vary due to factors like manufacturing processes, impurities, and microstructural differences. The stress-strain curve might not capture the full variability of material behavior.
Despite these limitations, the stress-strain curve remains a valuable tool for understanding and predicting material behavior under specific conditions. However, engineers and researchers should be aware of these limitations and use the curve in conjunction with other tests and analyses to gain a more comprehensive understanding of material performance.
Reference : https://en.wikipedia.org/wiki/Stress%E2%80%93strain_curve